

At HVMG, our team of forward-thinkers are transforming hospitality performance by developing business intelligence solutions that empower data, processes and technology and enable our partners to make data-driven decisions that maximize profit and accelerate growth.
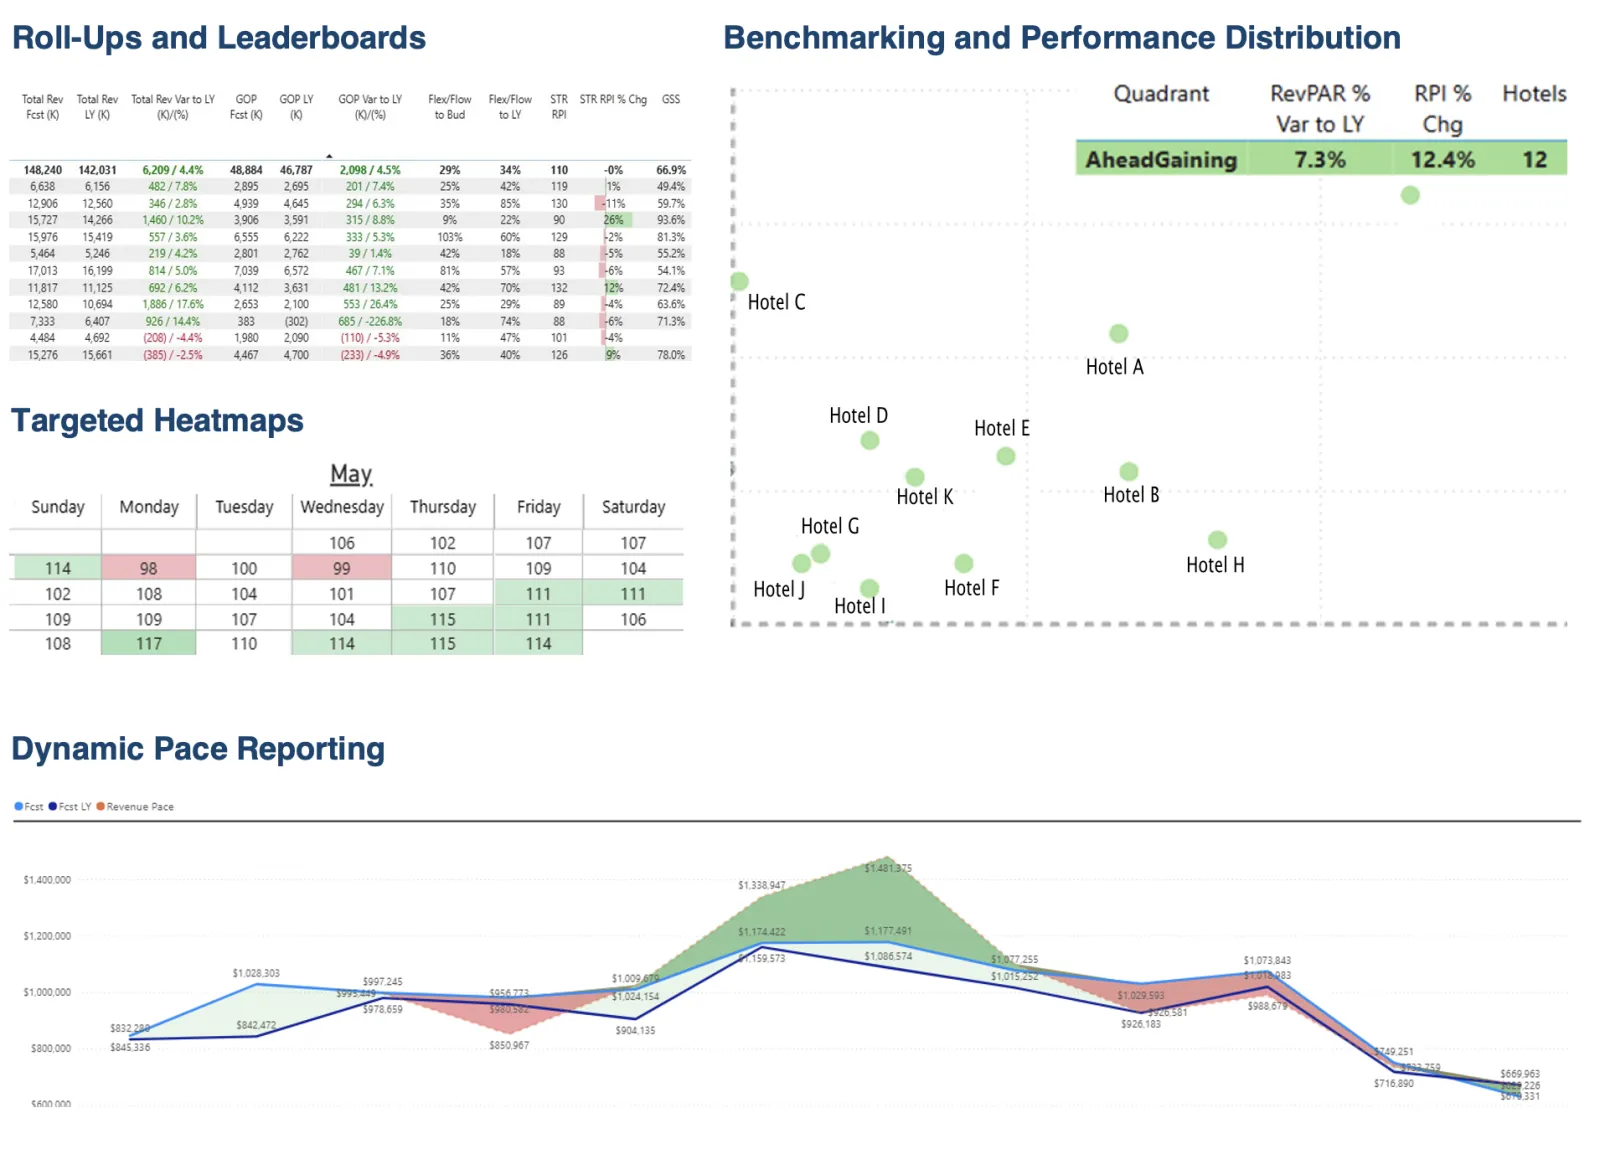
Proprietary Capabilities and Performance
- Prescriptive benchmarking
- Data-driven strategies
- Budgeting tools
- Customized reporting
- Enhanced forecasting capabilities
- Performance management